Using Our County Pages
Each Ohio county page provides you with information to help you plan your observation excursions, and to interpret your findings. Understanding the conventions used in this site, and its relationship to iNaturalist, will help you make the most effective use of your field time.

County Page Header
All 88 county pages follow the same content and layout conventions. There are two columns of data on a desktop or table, and one column of data on mobile devices.
The upper left hand page for each county starts with the name of the county, followed by a set of County Stats, including area, human population, and levels of observation (a summary version of this information for all counties can be found in a table on the County Lists page). Immediately below is a link to the County iNaturalist observations. This link opens up a Place Page in iNaturalist that outlines the county in red, showing all publicly viewable iNaturalist odonate observations within it, and summarizing those observations, and the associated species, within the county. This is a useful starting point for visualizing the volume and location of recent oda sightings in a specific area. Maximize the map to make it easier to see (click icon in lower left showing 4 outward pointing arrows).
Geography
The top right of each county page includes a clickable map showing the county’s location in Ohio. If you want to open the page for a neighboring county, or any other county in the state, move your curser over it, and click when it turns dark blue. Below the Ohio map is a paragraph on Geographic Context indicating the ecoregion (physiographic region) or regions the county is within, its major water features, and other geographic and biological information that might be relevant to its oda population. This section includes links to the Wikipedia page for the county, and usually contains Wikipedia or government pages for the other geographic features. Note that for some counties, this section might be below a photograph.
Observed Species
Immediately below County Stats on the left is the Observed Species table, a list of all the species that have ever been confirmed in the county as of the end of the previous season. It is initially sorted by the number of records for the species in the county, and like all the tables on the OOS site, each column can be sorted by clicking on the column header (order reversible with a second click). If you want to know if something you sighted is a new county record, start by checking to see if it is on this list. If you want to know how often a verified sighting of a species has been made in a specific county, or when it was last sighted, this is where to go. This information is based on a composite database that combines iNaturalist records, very few of which are more than 10 years old, with pre-digital records dating back to the late 19th century (see About the Ohio Dragonfly Survey). While the iNaturalist data is extremely useful for many purposes, virtually every county has historical records of at least 10 species that have not yet been observed by anyone using iNaturalist, and most counties have many more than that.
iNaturalist Integration
The Common Names (leftmost column of the Observed Species table) link to the respective iNaturalist pages for each listed species, providing access to a photo gallery, natural history information, and observation statistics.
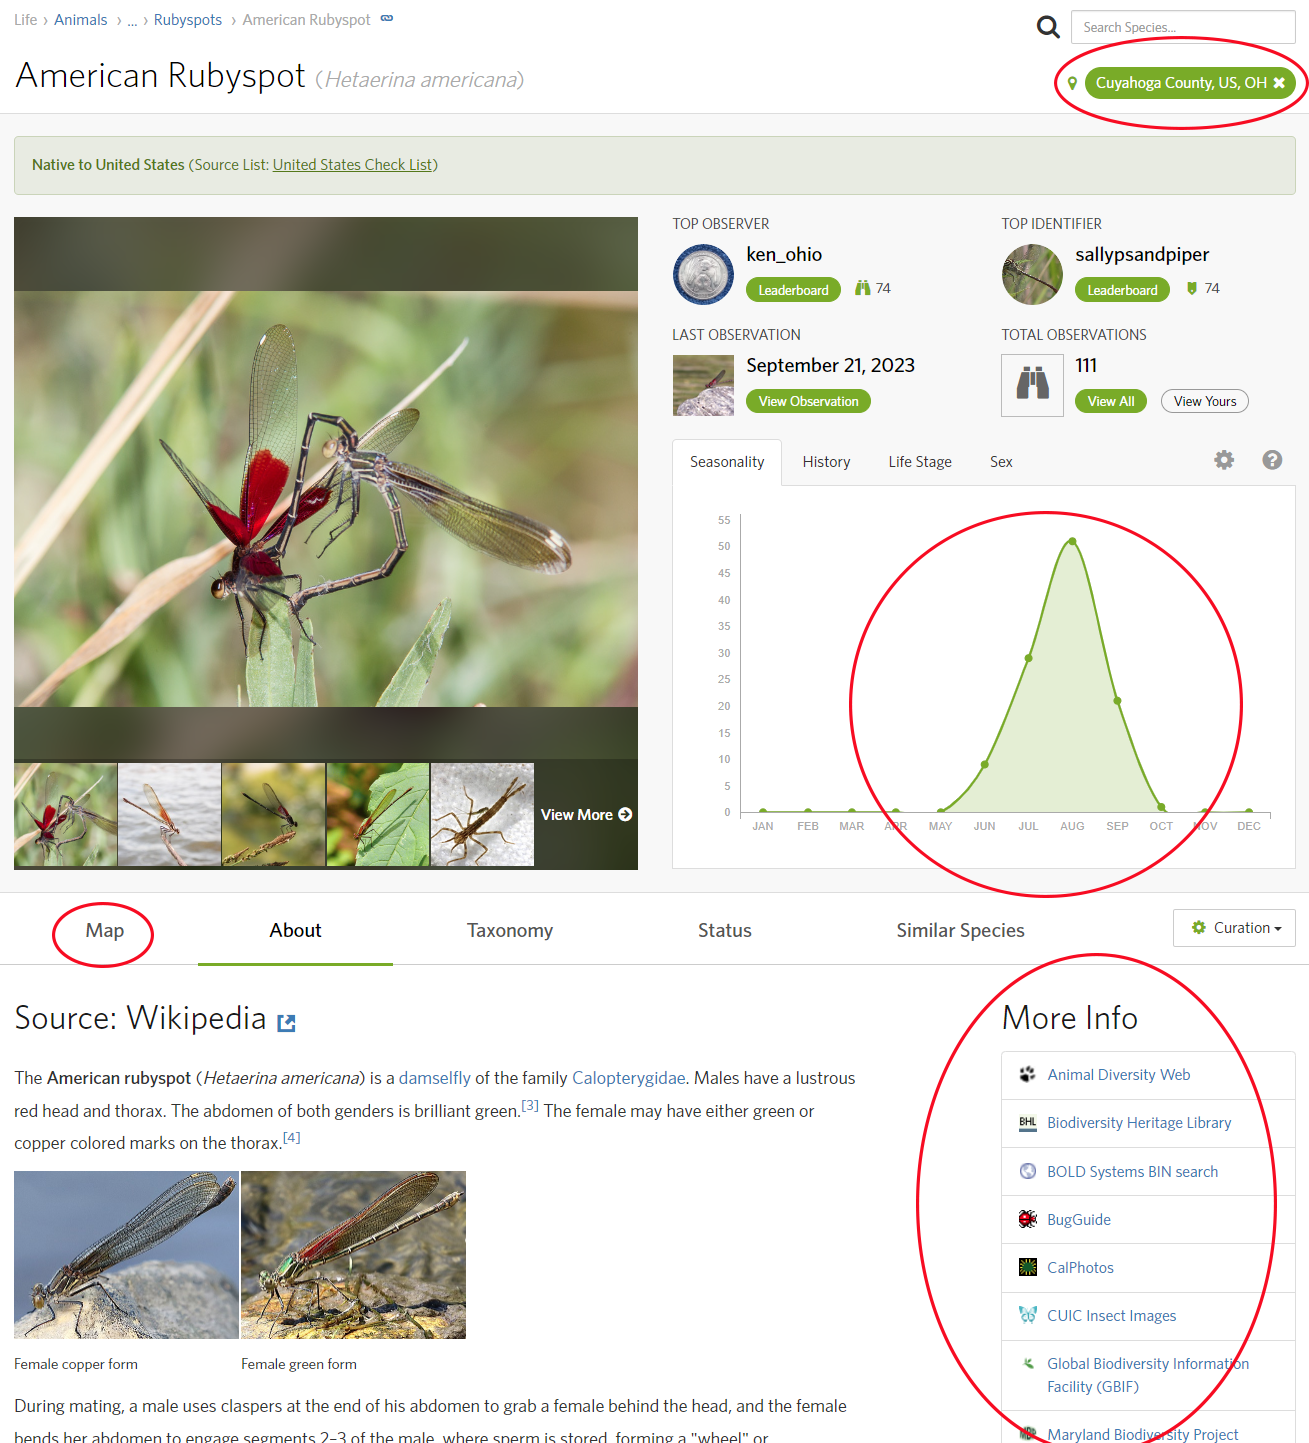
iNaturalist species page
View More provides access to an extended photo gallery that can be filtered by lifestage and sex.
Map provides an interactive geographic view of species distribution.
The About information is sourced from Wikipedia.
More Info links to additional sites. The Maryland Biodiversity Project is often a good choice for oda species that lack extensive Wikipedia writeups.
Filter By Place (upper right hand corner) filters iNaturalist data to a named locality.
When a locality has been specified, its name appears in a green oval in the upper right corner. This can be virtually any abstraction level from continent, country, state, city, to named region, park or property. It impacts the following areas of the taxon page:
Observation statistics: the number of observations of the species, by whom, and when
Graphs: Seasonality shows the cumulative monthly totals for observations.
Similar Species provides photographs and links to species commonly misidentified as the species under consideration. This useful identification tool is even more precise when results are limited to a specific locality. It provides you the ability to compare your tentative ID to other species in Ohio, or your county, that are a misleadingly close visual match, while reducing or eliminating species that are probably not found in the area.
Target Species
This table provides a prioritized list of odonata species considered likely to appear in a county, that have not yet been confirmed in that county. It is intended to encourage more county records. It is a speculative list, suggesting likely species based on observations in geographically contiguous counties.

Located directly under the Observed Species table, The Target Species table is sortable.
The species names in the left column link to the respective iNaturalist pages.
The default sort is the number of neighboring counties with a sighting. A species seen in 5 or 6 neighboring counties should be a better indicator of presence over a species only seen in 1 neighbor.
The Peak Active column is a rough estimation of when a not-yet-confirmed species would most likely be found (see Species Flight Range by Early Date for precise data on historical flight times).
Note that there is always a possibility of seeing a new species that has not been recorded in the general area. This will be especially true with the arrival of southern species.
Places to Visit
A growing percentage of the OOS county pages including a section providing guidance on publicly-accessible locations where odonates have been successfully observed.
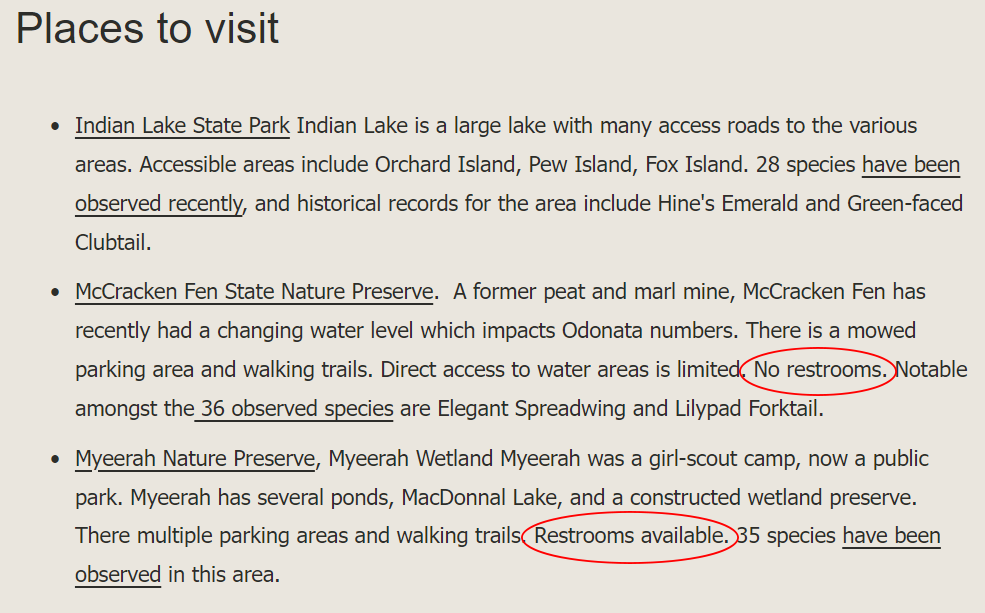
Dragonfly observers can share their favorite locations
The location name is linked to the page most-associated with the site. This is normally a page provided by the property owner or manager, but if that is not available, the link may be to Wikipedia, eBird, or other some other crowd-sourced site.
The text ‘have been observed’ links to an iNaturalist page centered on that location, showing exactly where oda have been observed.
The goal with this section is to continue collecting and sharing material that can help people unfamiliar with useful locations be aware that these locations exist, and to benefit from the site experience of people who are familiar with them. Its a flexible capability of the OOS website that can be significantly expanded to accommodate as much information as the community provides. Please contact us with your suggestions on oda hotspots.
County Observation Activity
The final section has two purposes. First, it provides a view of a county’s observation status, a sort of activity dashboard. Second, it is intended to encourage a more comprehensive survey of our state’s oda distribution.
It takes the form of a two-element graph showing the total number of odonata observations for the county in brown, with the average for all Ohio counties in blue. The 9 month flight season is divided into 26 segments of 10 or 11 days – essentially early-month, mid-month, and late-month. As indicated by the blue line, oda observation level in Ohio follows a normal, or bell, curve, somewhat skewed to the left, with an additional early peak of activity in late April when the first species appear. The difference between the blue line and the brown bars provides a quick visual indication of the level of observation activity in a county, relative to the state as a whole, across each time segment. The time segments are important, because many species have relatively short flight seasons. Low bars indicate time periods that have had low observation activity..
The potential always exists for finding new species in a county with high observation levels, but its likely that more species remain to be found in the Ohio counties with the lowest observation activity. Within all counties, but especially those with relatively low overall levels of observation activity, the discovery of new county records is more likely during the time segments with the lowest cumulative activity.

Comparing County Activity to State Activity: Below Average
In this example, the overall level of county observation activity is well below the state average for virtually every period of the season.
As indicated by the uneven pattern of the brown bars in this example, the number of observations per segment varies significantly, indicating a relatively uneven level of observation activity. This increases the likelihood that species with short flight seasons are being missed.
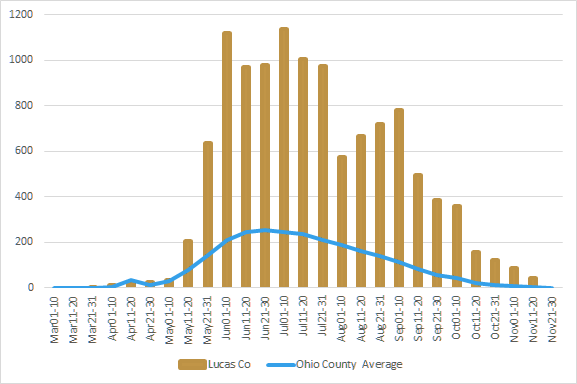
Comparing County Activity to State Activity: Above Average
In this example, the overall level of county observation activity is well above the state average for virtually every period of the season.
The number of observations per segment varies, indicating a partially uneven level of observation activity. The relatively high overall level of observation makes it less likely that some species are being missed, but further observation activity in early August might be useful.
Summary
If you are just starting out, or are looking for a specific species, then use the Observed Species lists, the Places to Visit, and iNaturalist to plan visits to places, and times, when you can be most successful. If you are interested in setting new county records (see So you want to get a county record), then use the Ohio Odonata Society county pages as springboards for deeper exploration.