Species Flight Distribution Charts (Part 1)
For our survey, it is important to know both where species are present, as well as when they occur. While some species are present through most of the Odonate season, many are limited to specific date periods. To this end, new species flight distribution charts have been created based on current Ohio Odonata Society data. We know these data are not complete, but we work with the information we are provided.

Compiled data from all years of the Ohio Odonata Society Database. Current as of December, 2017
The Ohio Dragonfly flight period starts in early March and concludes in late November. For our charting, these months are divided into nearly even segments of 1st to the 10th; 11th to the 20th; 21st to month end. Note some months in our target range have 30 days, others 31.
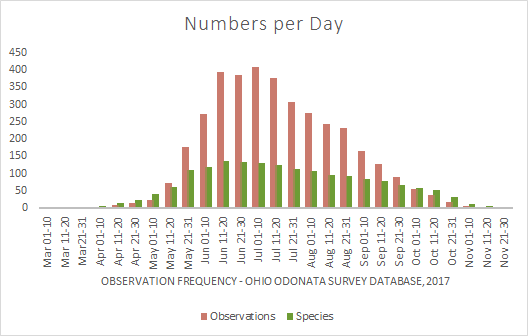
This graph shows all compiled observations prior to 2017 and includes both observation abundances (as much as they are reported) and the number of different species reported on that date.

This graph shows all compiled observations prior to 2017 and includes the observation abundances (as much as they are reported).

This graph shows all compiled observations prior to 2017 and includes the number of different species reported on that date.
The number of recorded observations for each species in the defined periods has been tabulated and used to create the various charts. For any species, you can see the approximate range of flight as well as the periods when most commonly observed. The total number for each period is also displayed. Less common species may tend to have sparse data – but still useful.

This gif shows the change in observations by year. Some years we have many more observations (survey years). Other years you can see a change in flight period with species being observed earlier or later into the season.
This gif is a stacked bar graph which combines all observations to show the main flight period (or main observing period) of dragonflies for Ohio.
We are interested in all of your observations. Observations that document a new record of place or flight – either early or late – is of value in helping understand our Odonates.
-Jim Lemon